mysql优化(六)sql语句分析

如何利用explain来分析sql语句,利用OPTIMIZER_TRACE对排序语句分析。

一.sql语句的优化

1.Sql语句的时间花在哪?

等待时间和执行时间
这两个时间并非孤立的,如果单条语句执行的快了对其他语句的锁定也就少了
分析如何降低执行时间。

2.Sql语句的执行时间,又花到哪了?

查找-> 沿着索引查找慢着可能全表扫描。
取出-> 查找行后把结果取出来。

如何查询快?

a) 查询的快—联合索引的顺序区分度,长度
b) 取的快,索引覆盖
c) 传输的少的行和列

切分查询:按数据拆成多次

如 : 插入10000行数据,每1000条为单位,插入
分解查询:按照逻辑把多表链接查询分成多个简单查询sql,

3.sql语句优化思路?

不查 —> 少查 –> 高效的查
不查,通过业务逻辑来计算

比如 论坛注册会员的数,我们可以根据前三个月统计每天注册量,用程序估算。

少量,尽可能精准数据,我们观察新闻网站,内容等一般一次性取列表10 –30条左右

必须查的尽量走在索引查询行
取时,取尽量少的列。比如 select * from tableA 取出所有列,不建议
如果定量分析查的多少行和是否沿着索引查?

二.使用explain来分析

id:代表select语句的编号,如果是链接查询表之间是平等关系select编号是从1开始,如果某select中有子查询则编号递增。

注意:id列数字越大越先执行,如果说数字一样大,那么就从上往下依次执行。

1
2
3
4
5
6
7
8
9
10
11
12
13
14
15
16
17
18
19
20
21
22
23
24
25
26
27
28
29
30
31
32
33
34
35
36
37
38
39
40
41
42
43
44
45
46
47
48
49
50
51
52
53
54
55
56
57
mysql> explain select id,user_name from l_manager where id in (select id from l_manager where id = 2)\G
*************************** 1. row ***************************
id: 1
select_type: SIMPLE
table: l_manager
partitions: NULL
type: const
possible_keys: PRIMARY
key: PRIMARY
key_len: 4
ref: const
rows: 1
filtered: 100.00
Extra: NULL
*************************** 2. row ***************************
id: 1
select_type: SIMPLE
table: l_manager
partitions: NULL
type: const
possible_keys: PRIMARY
key: PRIMARY
key_len: 4
ref: const
rows: 1
filtered: 100.00
Extra: Using index
2 rows in set, 1 warning (0.00 sec)
mysql> explain SELECT * FROM `order` WHERE userID IN (SELECT id FROM `user` WHERE userName = 'admin')\G
*************************** 1. row ***************************
id: 1
select_type: SIMPLE
table: order
partitions: NULL
type: ALL
possible_keys: NULL
key: NULL
key_len: NULL
ref: NULL
rows: 1
filtered: 100.00
Extra: NULL
*************************** 2. row ***************************
id: 1
select_type: SIMPLE
table: user
partitions: NULL
type: eq_ref
possible_keys: PRIMARY
key: PRIMARY
key_len: 4
ref: imooc.order.userID
rows: 1
filtered: 100.00
Extra: Using where
2 rows in set, 1 warning (0.00 sec)

Select_type:查询类型

select_type Value JSON Name Meaning
SIMPLE None Simple SELECT (not using UNION or subqueries)
PRIMARY None Outermost SELECT
UNION None Second or later SELECT statement in a UNION
DEPENDENT UNION dependent (true) Second or later SELECT statement in a UNION, dependent on outer query
UNION RESULT union_result Result of a UNION.
SUBQUERY None First SELECT in subquery
DEPENDENT SUBQUERY dependent (true) First SELECT in subquery, dependent on outer query
DERIVED None Derived table SELECT (subquery in FROM clause)
MATERIALIZED materialized_from_subquery Materialized subquery
UNCACHEABLE SUBQUERY cacheable (false) A subquery for which the result cannot be cached and must be re-evaluated for each row of the outer query
UNCACHEABLE UNION cacheable (false) The second or later select in a UNION that belongs to an uncacheable subquery (see UNCACHEABLE SUBQUERY)

各项内容含义说明:

  • A:simple:表示不需要union操作或者不包含子查询的简单select查询。有连接查询时,外层的查询为simple,且只有一个。
  • B:primary:一个需要union操作或者含有子查询的select,位于最外层的单位查询的select_type即为primary。且只有一个。
  • C:union:union连接的select查询,除了第一个表外,第二个及以后的表select_type都是union。
  • D:dependent union:与union一样,出现在union 或union all语句中,但是这个查询要受到外部查询的影响
  • E:union result:包含union的结果集,在union和union all语句中,因为它不需要参与查询,所以id字段为null
  • F:subquery:除了from字句中包含的子查询外,其他地方出现的子查询都可能是subquery
  • G:dependent subquery:与dependent union类似,表示这个subquery的查询要受到外部表查询的影响
  • H:derived:from字句中出现的子查询。
  • I:materialized:被物化的子查询
  • J:UNCACHEABLE SUBQUERY:对于外层的主表,子查询不可被物化,每次都需要计算(耗时操作)
  • K:UNCACHEABLE UNION:UNION操作中,内层的不可被物化的子查询(类似于UNCACHEABLE SUBQUERY)
1
2
3
4
----Simple(不含子查询)
Select_type-
----Primary(含子查询或派生查询)----Derived (from型子查询)
----subquery(非from子查询)

Table:查询针对的表

有可能 实际表名或者表别名 (from A2 as a2)
Derived 如from 型子查询
Null 直接计算的结果不走表

Possible_key : 可能用到的索引

注意:可能用几个索引最终只能用一个

Key :最终用的索引

Key_len : 使用索引最大长度

注:有可能possible_keys为Null 而key不为NULL这种情况
Possible_keys分析的是索引用于查找的过程。
而最终的key可能是被用于查找,排序或索引覆盖

Type列: 是指查询的方式,非常重要是分析查数据的过程的重要依据

可能的值如下:
依次从好到差:system,const,eq_ref,ref,fulltext,ref_or_null,index_merge,unique_subquery,index_subquery,range,index,ALL,除了all之外,其他的type都可以使用到索引,除了index_merge之外,其他的type只可以用到一个索引

  • A:system:表中只有一行数据或者是空表,且只能用于myisam和memory表。如果是Innodb引擎表,type列在这个情况通常都是all或者index
  • B:const:使用唯一索引或者主键,返回记录一定是1行记录的等值where条件时,通常type是const。其他数据库也叫做唯一索引扫描
  • C:eq_ref:出现在要连接过个表的查询计划中,驱动表只返回一行数据,且这行数据是第二个表的主键或者唯一索引,且必须为not null,唯一索引和主键是多列时,只有所有的列都用作比较时才会出现eq_ref
  • D:ref:不像eq_ref那样要求连接顺序,也没有主键和唯一索引的要求,只要使用相等条件检索时就可能出现,常见与辅助索引的等值查找。或者多列主键、唯一索引中,使用第一个列之外的列作为等值查找也会出现,总之,返回数据不唯一的等值查找就可能出现。
  • E:fulltext:全文索引检索,要注意,全文索引的优先级很高,若全文索引和普通索引同时存在时,mysql不管代价,优先选择使用全文索引
  • F:ref_or_null:与ref方法类似,只是增加了null值的比较。实际用的不多。
    例如:
    SELECT * FROM ref_table
    WHERE key_column=expr OR key_column IS NULL;
  • G:index_merge:表示查询使用了两个以上的索引,最后取交集或者并集,常见and ,or的条件使用了不同的索引,官方排序这个在ref_or_null之后,但是实际上由于要读取所个索引,性能可能大部分时间都不如range
  • H:unique_subquery:用于where中的in形式子查询,子查询返回不重复值唯一值
  • I:index_subquery:用于in形式子查询使用到了辅助索引或者in常数列表,子查询可能返回重复值,可以使用索引将子查询去重。
  • J:range:索引范围扫描,常见于使用 =, <>, >, >=, <, <=, IS NULL, <=>, BETWEEN, IN()或者like等运算符的查询中。
  • K:index:索引全表扫描,把索引从头到尾扫一遍,常见于使用索引列就可以处理不需要读取数据文件的查询、可以使用索引排序或者分组的查询。按照官方文档的说法:
  • all :意味着从标的第一行往后逐行扫描,运气不好扫描到最后一行。

通俗说:all扫描所有的数据行,相当于data_all index扫描所有索引节点相当于index_all
Range:意思是查询时能根据索引做范围扫描
1索引覆盖的查询情况下,能利用上索引数据,但利用不上索引查询必须全索引扫描

以上说的是索引扫描的两种情况,一种是查询使用了覆盖索引,那么它只需要扫描索引就可以获得数据,这个效率要比全表扫描要快,因为索引通常比数据表小,而且还能避免二次查询。在extra中显示Using index,反之,如果在索引上进行全表扫描,没有Using index的提示。

Ref:意思指通过索引列可以直接引用到某些数据行

Eq_ref 是指通过索引列直接引用某1行数据
常见于链接查询中
Const,system,null 这三个分别指查询优化到常量级别甚至不需要查询时间
一般按照主键查询易出现const,system
或者直接查询某个表达式不经过表时,出现null

Rows:预计要扫描多少行

Extra:

1
2
3
4
If you want to make your queries as fast as possible,
look out for Extra column values of Using filesort and Using temporary,
or, in JSON-formatted EXPLAINoutput,
for using_filesort and using_temporary_table properties equal to true.

大概的意思就是说,如果你想要优化你的查询,那就要注意extra辅助信息中的using filesort和using temporary,这两项非常消耗性能,需要注意。

  • A:distinct:在select部分使用了distinc关键字。
  • B:no tables used:不带from字句的查询或者From dual查询。
  • C:使用not in()形式子查询或not exists运算符的连接查询,这种叫做反连接。即,一般连接查询是先查询内表,再查询外表,反连接就是先查询外表,再查询内表。
  • D:using filesort:排序时无法使用到索引时,就会出现这个。常见于order by和group by语句中。
  • E:using index:查询时不需要回表查询,直接通过索引就可以获取查询的数据。
  • F:using join buffer(block nested loop),using join buffer(batched key accss):5.6.x之后的版本优化关联查询的BNL,BKA特性。主要是减少内表的循环数量以及比较顺序地扫描查询。
  • G:using sort_union,using_union,using intersect,using sort_intersection
      using intersect:表示使用and的各个索引的条件时,该信息表示是从处理结果获取交集。
      using union:表示使用or连接各个使用索引的条件时,该信息表示从处理结果获取并集。
      using sort_union和using sort_intersection:与前面两个对应的类似,只是他们是出现在用and和or查询信息量大时,先查询主键,然后进行排序合并后,才能读取记录并返回。
  • H:using temporary:表示使用了临时表存储中间结果。临时表可以是内存临时表和磁盘临时表,执行计划中看不出来,需要查看status变量,used_tmp_table,used_tmp_disk_table才能看出来。
  • I:using where:表示存储引擎返回的记录并不是所有的都满足查询条件,需要在server层进行过滤。查询条件中分为限制条件和检查条件,5.6之前,存储引擎只能根据限制条件扫描数据并返回,然后server层根据检查条件进行过滤再返回真正符合查询的数据。5.6.x之后支持ICP特性,可以把检查条件也下推到存储引擎层,不符合检查条件和限制条件的数据,直接不读取,这样就大大减少了存储引擎扫描的记录数量。extra列显示using index condition。
  • J:firstmatch(tb_name):5.6.x开始引入的优化子查询的新特性之一,常见于where字句含有in()类型的子查询。如果内表的数据量比较大,就可能出现这个。
  • K:loosescan(m..n):5.6.x之后引入的优化子查询的新特性之一,在in()类型的子查询中,子查询返回的可能有重复记录时,就可能出现这个。

Index是指用到索引覆盖,效率非常高
Using where 是指只靠索引无法定位。还需要where判断
Using temporary 指用上了临时表,ground by 与 order by 不同列时或ground by 与 order by 别的表的列
Using filesort 文件排序(文件可能在磁盘,也可能在内存)

三、OPTIMIZER_TRACE

从MySQL5.6版本开始,optimizer_trace 可支持把MySQL查询执行计划树打印出来,对DBA深入分析SQL执行计划,COST成本都非常有用,打印的内部信息比较全面。默认是关闭的,功能支持动态开关,因为对性能有20%左右影响,只建议分析问题时,临时开启。

1. 默认是关闭的

1
mysql> show variables like 'optimizer_trace';
Variable_name Value
optimizer_trace enabled=off,one_line=off

1 row in set (0.05 sec)

2.演示 optimizer_trace 简单的使用流程:

1
2
3
4
5
6
7
8
9
10
11
12
13
14
15
16
17
18
19
set tmp_table_size=1024;
set sort_buffer_size=32768;
set max_length_for_sort_data=16;
set optimizer_trace_max_mem_size=1000000; --- 设置trace大小
set end_markers_in_json=on; --- 增加trace中注释
/* 打开 optimizer_trace,只对本线程有效 */
SET optimizer_trace='enabled=on';
/* 执行语句 */
select word from words order by rand() limit 3;
/* 查看 OPTIMIZER_TRACE 输出 */
SELECT * FROM `information_schema`.`OPTIMIZER_TRACE`\G
/* 关闭 optimizer_trace*/
SET optimizer_trace='enabled=off';
补充:永久开启 optimizer_trace (重启失效)
mysql> set optimizer_trace="enabled=on";

官方文档给出了一个不错的例子,比这里的这个要复杂多了,有兴趣的同学可自行翻阅:
http://dev.mysql.com/doc/internals/en/tracing-example.html

四、SHOW PROCESSLIST

SHOW PROCESSLIST显示哪些线程正在运行。您也可以使用mysqladmin processlist语句得到此信息。如果您有SUPER权限,您可以看到所有线程。否则,您只能看到您自己的线程

MySQL保留一个额外的连接,让拥有SUPER权限的 账户使用,以确保管理员能够随时连接和检查系统(假设您没有把此权限给予所有的用户)。

1
2
3
4
5
6
7
8
mysql> show full processlist;
+---------+-------------+--------------------+----------------+-------------+-------+-----------------------------------------------------------------------+-----------------------+
| Id | User | Host | db | Command | Time | State | Info |
+---------+-------------+--------------------+----------------+-------------+-------+-----------------------------------------------------------------------+-----------------------+
| 1056536 | replication | 192.168.6.91:38417 | NULL | Binlog Dump | 33759 | Master has sent all binlog to slave; waiting for binlog to be updated | NULL |
| 1107067 | miaohr | 192.168.6.81:32024 | NULL | Query | 0 | NULL | show full processlist |
| 1107182 | miaohr | 192.168.6.91:44217 | hr_db_business | Sleep | 1 | | NULL |
+---------+-------------+--------------------+----------------+-------------+-------+-----------------------------------------------------------------------+-----------------------+

介绍一下八个参数:

  • id #ID标识,要kill一个语句的时候很有用
  • use #当前连接用户
  • host #显示这个连接从哪个ip的哪个端口上发出
  • db #数据库名
  • command #连接状态,一般是休眠(sleep),查询(query),连接(connect)
  • time #连接持续时间,单位是秒
  • state #显示当前sql语句的状态
  • info #显示这个sql语句

其中state的状态十分关键,下表列出state主要状态和描述:

状态 描述
Checking table 正在检查数据表(这是自动的)。
Closing tables 正在将表中修改的数据刷新到磁盘中,同时正在关闭已经用完的表。这是一个很快的操作,如果不是这样的话,就应该确认磁盘空间是否已经满了或者磁盘是否正处于重负中。
Connect Out 复制从服务器正在连接主服务器。
Copying to tmp table on disk 由于临时结果集大于tmp_table_size,正在将临时表从内存存储转为磁盘存储以此节省内存。
Creating tmp table 正在创建临时表以存放部分查询结果。
deleting from main table 服务器正在执行多表删除中的第一部分,刚删除第一个表。
deleting from reference tables 服务器正在执行多表删除中的第二部分,正在删除其他表的记录。
Flushing tables 正在执行FLUSH TABLES,等待其他线程关闭数据表。
Killed 发送了一个kill请求给某线程,那么这个线程将会检查kill标志位,同时会放弃下一个kill请求。MySQL会在每次的主循环中检查kill标志位,不过有些情况下该线程可能会过一小段才能死掉。如果该线程程被其他线程锁住了,那么kill请求会在锁释放时马上生效。
Locked 被其他查询锁住了。
Sending data 正在处理SELECT查询的记录,同时正在把结果发送给客户端。
Sorting for group 正在为GROUP BY做排序。
Sorting for order 正在为ORDER BY做排序。
Opening tables 这个过程应该会很快,除非受到其他因素的干扰。例如,在执ALTER TABLE或LOCK TABLE语句行完以前,数据表无法被其他线程打开。正尝试打开一个表。
Removing duplicates 正在执行一个SELECT DISTINCT方式的查询,但是MySQL无法在前一个阶段优化掉那些重复的记录。因此,MySQL需要再次去掉重复的记录,然后再把结果发送给客户端。
Reopen table 获得了对一个表的锁,但是必须在表结构修改之后才能获得这个锁。已经释放锁,关闭数据表,正尝试重新打开数据表。
Repair by sorting 修复指令正在排序以创建索引。
Repair with keycache 修复指令正在利用索引缓存一个一个地创建新索引。它会比Repair by sorting慢些。
Searching rows for update 正在讲符合条件的记录找出来以备更新。它必须在UPDATE要修改相关的记录之前就完成了。
Sleeping 正在等待客户端发送新请求.
System lock 正在等待取得一个外部的系统锁。如果当前没有运行多个mysqld服务器同时请求同一个表,那么可以通过增加–skip-external-locking参数来禁止外部系统锁。
Upgrading lock INSERT DELAYED正在尝试取得一个锁表以插入新记录。
Updating 正在搜索匹配的记录,并且修改它们。
User Lock 正在等待GET_LOCK()。
Waiting for tables 该线程得到通知,数据表结构已经被修改了,需要重新打开数据表以取得新的结构。然后,为了能的重新打开数据表,必须等到所有其他线程关闭这个表。以下几种情况下会产生这个通知:FLUSH TABLES tbl_name, ALTER TABLE, RENAME TABLE, REPAIR TABLE, ANALYZE TABLE,或OPTIMIZE TABLE。
waiting for handler insert INSERT DELAYED已经处理完了所有待处理的插入操作,正在等待新的请求。

mysql 查看当前连接数
命令: show processlist;
如果是root帐号,你能看到所有用户的当前连接。如果是其它普通帐号,只能看到自己占用的连接。
show processlist;只列出前100条,如果想全列出请使用show full processlist;

MySQL 5.7版本,可以通过sys.innodb_lock_waits 表查到。

1
mysql> select * from t sys.innodb_lock_waits where locked_table=`'test(数据库名)'.'t(表名)'`\G

如图

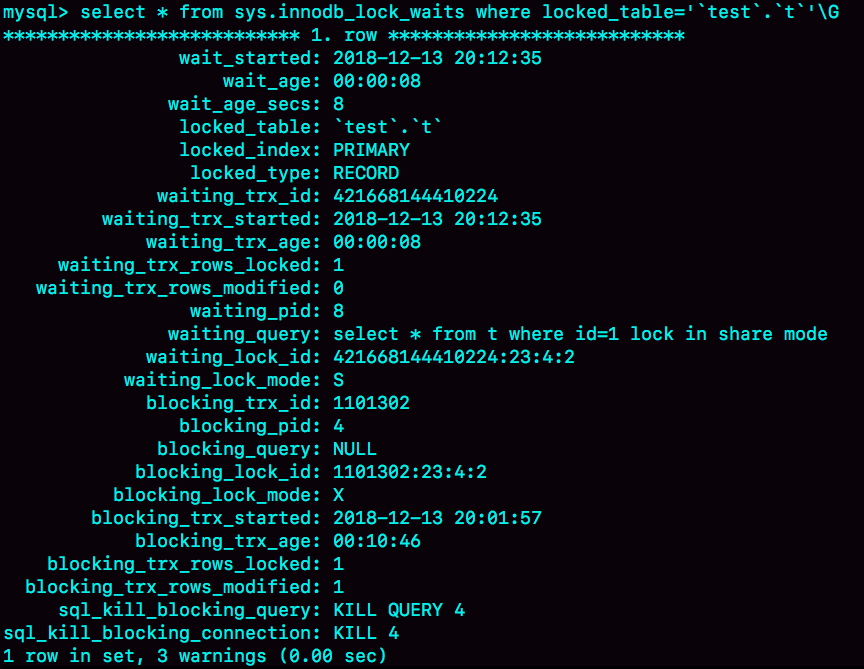
可以看到,这个信息很全,4号线程是造成堵塞的罪魁祸首。而干掉这个罪魁祸首的方式,就是KILL QUERY 4或KILL 4。

不过,这里不应该显示“KILL QUERY 4”。这个命令表示停止4号线程当前正在执行的语句,而这个方法其实是没有用的。因为占有行锁的是update语句,这个语句已经是之前执行完成了的,现在执行KILL QUERY,无法让这个事务去掉id=1上的行锁。

实际上,KILL 4才有效,也就是说直接断开这个连接。这里隐含的一个逻辑就是,连接被断开的时候,会自动回滚这个连接里面正在执行的线程,也就释放了id=1上的行锁。

mysql> show status;

SHOW STATUS命令会显示每个服务器变量的名字和值,状态变量是只读的。我们可以在MySQL客户端下运行SHOW STATUS或者在命令行运用mysqladmin extended-status来查看这些变量。如果使用SQL命令,可以使用LIKE或者WHERE来限制结果。LIKE可以对变量名做标准模式匹配。(大概300多条数据 可以了解一下)

1
2
3
4
5
6
7
8
9
10
11
12
13
14
15
16
17
18
19
20
21
22
23
24
25
26
27
28
29
30
31
32
33
34
35
36
37
38
39
40
41
42
43
44
45
46
47
48
49
50
51
52
53
54
55
56
57
58
59
60
61
62
63
64
65
66
67
68
69
70
71
72
73
74
75
76
77
78
79
80
81
82
83
84
85
86
87
88
89
90
91
92
93
94
95
96
97
98
99
100
101
102
103
104
105
106
107
108
109
110
111
112
113
114
115
116
117
118
119
120
121
122
123
124
125
126
127
128
129
130
131
132
133
134
135
136
137
138
139
140
141
142
143
144
145
146
147
148
149
150
151
152
153
154
155
156
157
158
159
160
161
162
163
164
165
166
167
168
169
170
171
172
173
174
175
176
177
178
179
180
181
182
183
184
185
186
187
188
189
190
191
192
193
194
195
196
197
198
199
200
201
202
203
204
205
206
207
208
209
210
211
212
213
214
215
216
217
218
219
220
221
222
223
224
225
226
227
228
229
230
231
232
233
234
235
236
237
238
239
240
241
242
243
244
245
246
247
248
249
250
251
252
253
254
255
256
257
258
259
260
261
262
263
264
265
266
267
268
269
270
271
272
273
274
275
276
277
278
279
280
281
282
283
284
285
286
287
288
289
290
291
292
293
294
295
296
297
298
299
300
301
302
303
304
305
306
307
308
309
310
311
312
313
314
315
316
317
318
319
320
321
322
323
324
325
326
327
328
329
330
331
332
333
334
335
336
337
338
339
340
341
342
343
344
345
346
347
348
349
350
351
352
353
354
355
356
357
+-----------------------------------------------+--------------------------------------------------+
Variable_name | Value |
+-----------------------------------------------+--------------------------------------------------+
| Aborted_clients | 1 |
| Aborted_connects | 0 |
| Binlog_cache_disk_use | 0 |
| Binlog_cache_use | 0 |
| Binlog_stmt_cache_disk_use | 0 |
| Binlog_stmt_cache_use | 0 |
| Bytes_received | 1968 |
| Bytes_sent | 165729 |
| Com_admin_commands | 0 |
| Com_assign_to_keycache | 0 |
| Com_alter_db | 0 |
| Com_alter_db_upgrade | 0 |
| Com_alter_event | 0 |
| Com_alter_function | 0 |
| Com_alter_instance | 0 |
| Com_alter_procedure | 0 |
| Com_alter_server | 0 |
| Com_alter_table | 0 |
| Com_alter_tablespace | 0 |
| Com_alter_user | 0 |
| Com_analyze | 0 |
| Com_begin | 0 |
| Com_binlog | 0 |
| Com_call_procedure | 0 |
| Com_change_db | 1 |
| Com_change_master | 0 |
| Com_change_repl_filter | 0 |
| Com_check | 0 |
| Com_checksum | 0 |
| Com_commit | 0 |
| Com_create_db | 0 |
| Com_create_event | 0 |
| Com_create_function | 0 |
| Com_create_index | 0 |
| Com_create_procedure | 0 |
| Com_create_server | 0 |
| Com_create_table | 0 |
| Com_create_trigger | 0 |
| Com_create_udf | 0 |
| Com_create_user | 0 |
| Com_create_view | 0 |
| Com_dealloc_sql | 0 |
| Com_delete | 0 |
| Com_delete_multi | 0 |
| Com_do | 0 |
| Com_drop_db | 0 |
| Com_drop_event | 0 |
| Com_drop_function | 0 |
| Com_drop_index | 0 |
| Com_drop_procedure | 0 |
| Com_drop_server | 0 |
| Com_drop_table | 0 |
| Com_drop_trigger | 0 |
| Com_drop_user | 0 |
| Com_drop_view | 0 |
| Com_empty_query | 0 |
| Com_execute_sql | 0 |
| Com_explain_other | 0 |
| Com_flush | 0 |
| Com_get_diagnostics | 0 |
| Com_grant | 0 |
| Com_ha_close | 0 |
| Com_ha_open | 0 |
| Com_ha_read | 0 |
| Com_help | 0 |
| Com_insert | 0 |
| Com_insert_select | 0 |
| Com_install_plugin | 0 |
| Com_kill | 0 |
| Com_load | 0 |
| Com_lock_tables | 0 |
| Com_optimize | 0 |
| Com_preload_keys | 0 |
| Com_prepare_sql | 0 |
| Com_purge | 0 |
| Com_purge_before_date | 0 |
| Com_release_savepoint | 0 |
| Com_rename_table | 0 |
| Com_rename_user | 0 |
| Com_repair | 0 |
| Com_replace | 0 |
| Com_replace_select | 0 |
| Com_reset | 0 |
| Com_resignal | 0 |
| Com_revoke | 0 |
| Com_revoke_all | 0 |
| Com_rollback | 0 |
| Com_rollback_to_savepoint | 0 |
| Com_savepoint | 0 |
| Com_select | 20 |
| Com_set_option | 7 |
| Com_signal | 0 |
| Com_show_binlog_events | 0 |
| Com_show_binlogs | 0 |
| Com_show_charsets | 0 |
| Com_show_collations | 0 |
| Com_show_create_db | 0 |
| Com_show_create_event | 0 |
| Com_show_create_func | 0 |
| Com_show_create_proc | 0 |
| Com_show_create_table | 0 |
| Com_show_create_trigger | 0 |
| Com_show_databases | 1 |
| Com_show_engine_logs | 0 |
| Com_show_engine_mutex | 0 |
| Com_show_engine_status | 0 |
| Com_show_events | 0 |
| Com_show_errors | 0 |
| Com_show_fields | 0 |
| Com_show_function_code | 0 |
| Com_show_function_status | 0 |
| Com_show_grants | 0 |
| Com_show_keys | 0 |
| Com_show_master_status | 0 |
| Com_show_open_tables | 0 |
| Com_show_plugins | 0 |
| Com_show_privileges | 0 |
| Com_show_procedure_code | 0 |
| Com_show_procedure_status | 0 |
| Com_show_processlist | 1 |
| Com_show_profile | 0 |
| Com_show_profiles | 0 |
| Com_show_relaylog_events | 0 |
| Com_show_slave_hosts | 0 |
| Com_show_slave_status | 0 |
| Com_show_status | 2 |
| Com_show_storage_engines | 0 |
| Com_show_table_status | 0 |
| Com_show_tables | 1 |
| Com_show_triggers | 0 |
| Com_show_variables | 8 |
| Com_show_warnings | 0 |
| Com_show_create_user | 0 |
| Com_shutdown | 0 |
| Com_slave_start | 0 |
| Com_slave_stop | 0 |
| Com_group_replication_start | 0 |
| Com_group_replication_stop | 0 |
| Com_stmt_execute | 0 |
| Com_stmt_close | 0 |
| Com_stmt_fetch | 0 |
| Com_stmt_prepare | 0 |
| Com_stmt_reset | 0 |
| Com_stmt_send_long_data | 0 |
| Com_truncate | 0 |
| Com_uninstall_plugin | 0 |
| Com_unlock_tables | 0 |
| Com_update | 0 |
| Com_update_multi | 0 |
| Com_xa_commit | 0 |
| Com_xa_end | 0 |
| Com_xa_prepare | 0 |
| Com_xa_recover | 0 |
| Com_xa_rollback | 0 |
| Com_xa_start | 0 |
| Com_stmt_reprepare | 0 |
| Connection_errors_accept | 0 |
| Connection_errors_internal | 0 |
| Connection_errors_max_connections | 0 |
| Connection_errors_peer_address | 0 |
| Connection_errors_select | 0 |
| Connection_errors_tcpwrap | 0 |
| Connections | 4 |
| Created_tmp_disk_tables | 12 |
| Created_tmp_files | 5 |
| Created_tmp_tables | 16 |
| Delayed_errors | 0 |
| Delayed_insert_threads | 0 |
| Delayed_writes | 0 |
| Flush_commands | 1 |
| Handler_commit | 16 |
| Handler_delete | 0 |
| Handler_discover | 0 |
| Handler_external_lock | 257 |
| Handler_mrr_init | 0 |
| Handler_prepare | 0 |
| Handler_read_first | 23 |
| Handler_read_key | 30 |
| Handler_read_last | 0 |
| Handler_read_next | 2 |
| Handler_read_prev | 0 |
| Handler_read_rnd | 3 |
| Handler_read_rnd_next | 59074 |
| Handler_rollback | 0 |
| Handler_savepoint | 0 |
| Handler_savepoint_rollback | 0 |
| Handler_update | 0 |
| Handler_write | 473 |
| Innodb_buffer_pool_dump_status | Dumping of buffer pool not started |
| Innodb_buffer_pool_load_status | Buffer pool(s) load completed at 191017 11:10:21 |
| Innodb_buffer_pool_resize_status | |
| Innodb_buffer_pool_pages_data | 396 |
| Innodb_buffer_pool_bytes_data | 6488064 |
| Innodb_buffer_pool_pages_dirty | 0 |
| Innodb_buffer_pool_bytes_dirty | 0 |
| Innodb_buffer_pool_pages_flushed | 140 |
| Innodb_buffer_pool_pages_free | 7796 |
| Innodb_buffer_pool_pages_misc | 0 |
| Innodb_buffer_pool_pages_total | 8192 |
| Innodb_buffer_pool_read_ahead_rnd | 0 |
| Innodb_buffer_pool_read_ahead | 0 |
| Innodb_buffer_pool_read_ahead_evicted | 0 |
| Innodb_buffer_pool_read_requests | 6547 |
| Innodb_buffer_pool_reads | 340 |
| Innodb_buffer_pool_wait_free | 0 |
| Innodb_buffer_pool_write_requests | 1437 |
| Innodb_data_fsyncs | 7 |
| Innodb_data_pending_fsyncs | 0 |
| Innodb_data_pending_reads | 0 |
| Innodb_data_pending_writes | 0 |
| Innodb_data_read | 7492096 |
| Innodb_data_reads | 503 |
| Innodb_data_writes | 157 |
| Innodb_data_written | 2328576 |
| Innodb_dblwr_pages_written | 2 |
| Innodb_dblwr_writes | 1 |
| Innodb_log_waits | 0 |
| Innodb_log_write_requests | 0 |
| Innodb_log_writes | 2 |
| Innodb_os_log_fsyncs | 4 |
| Innodb_os_log_pending_fsyncs | 0 |
| Innodb_os_log_pending_writes | 0 |
| Innodb_os_log_written | 1024 |
| Innodb_page_size | 16384 |
| Innodb_pages_created | 57 |
| Innodb_pages_read | 339 |
| Innodb_pages_written | 140 |
| Innodb_row_lock_current_waits | 0 |
| Innodb_row_lock_time | 0 |
| Innodb_row_lock_time_avg | 0 |
| Innodb_row_lock_time_max | 0 |
| Innodb_row_lock_waits | 0 |
| Innodb_rows_deleted | 0 |
| Innodb_rows_inserted | 24098 |
| Innodb_rows_read | 54115 |
| Innodb_rows_updated | 0 |
| Innodb_num_open_files | 21 |
| Innodb_truncated_status_writes | 0 |
| Innodb_available_undo_logs | 128 |
| Key_blocks_not_flushed | 0 |
| Key_blocks_unused | 6695 |
| Key_blocks_used | 3 |
| Key_read_requests | 6 |
| Key_reads | 3 |
| Key_write_requests | 0 |
| Key_writes | 0 |
| Locked_connects | 0 |
| Max_execution_time_exceeded | 0 |
| Max_execution_time_set | 0 |
| Max_execution_time_set_failed | 0 |
| Max_used_connections | 1 |
| Max_used_connections_time | 2019-10-17 11:13:59 |
| Not_flushed_delayed_rows | 0 |
| Ongoing_anonymous_transaction_count | 0 |
| Open_files | 14 |
| Open_streams | 0 |
| Open_table_definitions | 106 |
| Open_tables | 102 |
| Opened_files | 139 |
| Opened_table_definitions | 106 |
| Opened_tables | 109 |
| Performance_schema_accounts_lost | 0 |
| Performance_schema_cond_classes_lost | 0 |
| Performance_schema_cond_instances_lost | 0 |
| Performance_schema_digest_lost | 0 |
| Performance_schema_file_classes_lost | 0 |
| Performance_schema_file_handles_lost | 0 |
| Performance_schema_file_instances_lost | 0 |
| Performance_schema_hosts_lost | 0 |
| Performance_schema_index_stat_lost | 0 |
| Performance_schema_locker_lost | 0 |
| Performance_schema_memory_classes_lost | 0 |
| Performance_schema_metadata_lock_lost | 0 |
| Performance_schema_mutex_classes_lost | 0 |
| Performance_schema_mutex_instances_lost | 0 |
| Performance_schema_nested_statement_lost | 0 |
| Performance_schema_prepared_statements_lost | 0 |
| Performance_schema_program_lost | 0 |
| Performance_schema_rwlock_classes_lost | 0 |
| Performance_schema_rwlock_instances_lost | 0 |
| Performance_schema_session_connect_attrs_lost | 0 |
| Performance_schema_socket_classes_lost | 0 |
| Performance_schema_socket_instances_lost | 0 |
| Performance_schema_stage_classes_lost | 0 |
| Performance_schema_statement_classes_lost | 0 |
| Performance_schema_table_handles_lost | 0 |
| Performance_schema_table_instances_lost | 0 |
| Performance_schema_table_lock_stat_lost | 0 |
| Performance_schema_thread_classes_lost | 0 |
| Performance_schema_thread_instances_lost | 0 |
| Performance_schema_users_lost | 0 |
| Prepared_stmt_count | 0 |
| Qcache_free_blocks | 1 |
| Qcache_free_memory | 1031872 |
| Qcache_hits | 0 |
| Qcache_inserts | 0 |
| Qcache_lowmem_prunes | 0 |
| Qcache_not_cached | 20 |
| Qcache_queries_in_cache | 0 |
| Qcache_total_blocks | 1 |
| Queries | 45 |
| Questions | 44 |
| Select_full_join | 0 |
| Select_full_range_join | 0 |
| Select_range | 0 |
| Select_range_check | 0 |
| Select_scan | 27 |
| Slave_open_temp_tables | 0 |
| Slow_launch_threads | 0 |
| Slow_queries | 0 |
| Sort_merge_passes | 0 |
| Sort_range | 0 |
| Sort_rows | 6 |
| Sort_scan | 2 |
| Ssl_accept_renegotiates | 0 |
| Ssl_accepts | 0 |
| Ssl_callback_cache_hits | 0 |
| Ssl_cipher | |
| Ssl_cipher_list | |
| Ssl_client_connects | 0 |
| Ssl_connect_renegotiates | 0 |
| Ssl_ctx_verify_depth | 0 |
| Ssl_ctx_verify_mode | 0 |
| Ssl_default_timeout | 0 |
| Ssl_finished_accepts | 0 |
| Ssl_finished_connects | 0 |
| Ssl_server_not_after | |
| Ssl_server_not_before | |
| Ssl_session_cache_hits | 0 |
| Ssl_session_cache_misses | 0 |
| Ssl_session_cache_mode | NONE |
| Ssl_session_cache_overflows | 0 |
| Ssl_session_cache_size | 0 |
| Ssl_session_cache_timeouts | 0 |
| Ssl_sessions_reused | 0 |
| Ssl_used_session_cache_entries | 0 |
| Ssl_verify_depth | 0 |
| Ssl_verify_mode | 0 |
| Ssl_version | |
| Table_locks_immediate | 108 |
| Table_locks_waited | 0 |
| Table_open_cache_hits | 20 |
| Table_open_cache_misses | 109 |
| Table_open_cache_overflows | 0 |
| Tc_log_max_pages_used | 0 |
| Tc_log_page_size | 0 |
| Tc_log_page_waits | 0 |
| Threads_cached | 0 |
| Threads_connected | 1 |
| Threads_created | 1 |
| Threads_running | 1 |
| Uptime | 30105 |
| Uptime_since_flush_status | 30105 |
+-----------------------------------------------+--------------------------------------------------+

SHOW VARIABLES LIKE ‘%timeout%’

1
2
3
4
5
6
7
8
9
10
11
12
13
14
15
16
17
18
mysql> SHOW VARIABLES LIKE '%timeout%';
+-----------------------------+----------+
| Variable_name | Value |
+-----------------------------+----------+
| connect_timeout | 10 |
| delayed_insert_timeout | 300 |
| have_statement_timeout | YES |
| innodb_flush_log_at_timeout | 1 |
| innodb_lock_wait_timeout | 50 |
| innodb_rollback_on_timeout | OFF |
| interactive_timeout | 28800 |
| lock_wait_timeout | 31536000 |
| net_read_timeout | 30 |
| net_write_timeout | 60 |
| rpl_stop_slave_timeout | 31536000 |
| slave_net_timeout | 60 |
| wait_timeout | 28800 |
+-----------------------------+----------+
参数名 描述
connect_timeout 在获取链接时,等待握手的超时时间,只在登录时有效,登录成功这个参数就不管事了。主要是为了防止网络不佳时应用重连导致连接数涨太快,一般默认即可。
delayed_insert_timeout 这是为MyISAM INSERT DELAY设计的超时参数,在INSERT DELAY中止前等待INSERT语句的时间。
innodb_lock_wait_timeout 描述很长,简而言之,就是事务遇到锁等待时的Query超时时间。跟死锁不一样,InnoDB一旦检测到死锁立刻就会回滚代价小的那个事务,锁等待是没有死锁的情况下一个事务持有另一个事务需要的锁资源,被回滚的肯定是请求锁的那个Query。
innodb_rollback_on_timeout 这个参数关闭或不存在的话遇到超时只回滚事务最后一个Query,打开的话事务遇到超时就回滚整个事务。This variable was added in MySQL 5.1.15.
interactive_timeout/wait_timeout 一个持续SLEEP状态的线程多久被关闭。线程每次被使用都会被唤醒为activity状态,执行完Query后成为interactive状态,重新开始计时。wait_timeout不同在于只作用于TCP/IP和Socket链接的线程,意义是一样的。
net_read_timeout / net_write_timeout 这个参数只对TCP/IP链接有效,分别是数据库等待接收客户端发送网络包和发送网络包给客户端的超时时间,这是在Activity状态下的线程才有效的参数
slave_net_timeout 这是Slave判断主机是否挂掉的超时设置,在设定时间内依然没有获取到Master的回应就人为Master挂掉了

更多的show variables like xxx 详解mysql运行时参数
https://blog.csdn.net/mooncarp/article/details/51787694